Pareto图又称排列图,是一种柱状图,按事件发生的频率排序而成,它显示由于各种原因引起的缺陷数量或不一致的排列顺序,是找出影响项目产品或服务质量的主要因素的方法。只有找到影响项目质量的主要因素,才能有的放矢,取得良好的经济效益。pareto图中根据柱图顶端生成的曲线为Pareto曲线,说明了项目实施失败的各种原因。其中,各影响因素的排列顺序用于指导纠正措施,即项目组应该首先解决引起更多缺陷的问题
在留学生论文写作中,柏拉图分析图应用十分广泛,尤其在于质量管理和项目管理类assignment中,不过仍然有很多小伙伴不知道Pareto analysis chart怎么用,下面我们就来给大家讲讲:
|
Detailed Problem
|
Percentage
|
Cumulative
|
|
Unskillful workers.
|
37
|
37
|
|
Lack of communication between managers and subordinates.
|
25
|
62
|
|
Talent bleeding.
|
5
|
67
|
|
Unclear job description.
|
5
|
72
|
|
Unreasonable scheduling
|
4
|
76
|
|
Unreasonable job design.
|
4
|
80
|
|
Old equipments & machines.
|
3
|
83
|
|
Unsuitable technology
|
3
|
86
|
|
Poor working place condition.
|
3
|
89
|
|
Improper maintenance assembly line
|
2
|
91
|
|
Lack of experience workers & engineers.
|
2
|
93
|
|
Poor working discipline.
|
2
|
95
|
|
Poor quality materials and accessories.
|
2
|
97
|
|
Poor inspection.
|
1
|
98
|
|
Unreliable suppliers.
|
1
|
99
|
|
Improper stock condition.
|
1
|
100
|
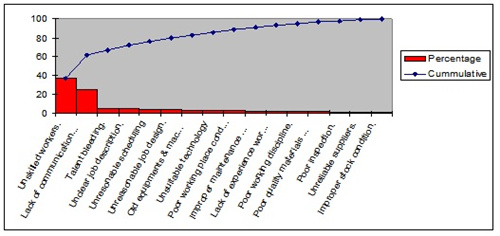
The Pareto rule, often called the 80/20 rule, is a tool for diagnosing a business problem. The rule says that a problem has multiple causes, and that 20 percent of the causes account for 80 percent of the problem. Reading a Pareto chart identifies 20 percent of the causes so that you can correct them and solve 80 percent of your problem.
Read the label along the left side vertical axis, commonly called the y-axis, on a standard Pareto chart. This data will be listed in units. These units will line up with descending bars coming from the horizontal axis, commonly called the x-axis.
Line up the units of each bar with the left y-axis, which outlines how many times something occurred. For example, the chart may record the number of times a person was on hold for more than five minutes while waiting to talk to a customer service representative. The first bar, which might be labeled “Too few representatives on staff,” would be the largest and line up with the biggest units.
Coordinate each bar with the right side y-axis. This will tell you what percent of all the units that one bar comprises. If the first bar lines up with the 30 percent line, then 30 percent of the instances for your problem happened because of that cause.
Follow the upward curving line. This will attach a percentage that lines up with each bar. These percentages are cumulative. If the first bar accounts for 30 percent and the second bar accounts for 15 percent, the dot on the line above the second bar will read 45 percent, meaning these two results are causing 45 percent of the problem.
Solve your problem by eliminating the set of results that equal 80 percent. For example, if the first three bars equal approximately 80 percent cumulatively, fix these causes.